Methodology
This section outlines our approach to time series forecasting and portfolio optimization using ARIMA, Chronos-Bolt, and sentiment analysis for stock return prediction.

An Overview of our methodology workflow
Traditional Time Series Analysis with ARIMA
AutoRegressive Integrated Moving Average (ARIMA) forecasts stock prices through three key components:
- Autoregressive (AR): Uses past values to predict future values
- Differencing (I): Removes trends to ensure stationarity
- Moving Average (MA): Models past forecast errors
The general ARIMA model is given by:
\[Y_t = c + \sum_{i=1}^{p} \phi_i Y_{t-i} + \sum_{j=1}^{q} \theta_j \epsilon_{t-j} + \epsilon_t\]where \(Y_t\) is the value at time \(t\), \(c\) is a constant, \(\phi_i\) are AR coefficients, \(\theta_j\) are MA coefficients, and \(\epsilon_t\) is white noise.
Our implementation features:
- Hyperparameter Optimization: Using auto_arima from pmdarima to select optimal parameters based on AIC, with manual grid search as fallback
- Recursive Forecasting: Prediction in shorter chunks (up to 10 days) with rolling windows to capture recent trends
- Robust Error Handling: Including model retries, fallback to simpler ARIMA(1,1,0), and naive forecasting with random noise (±2%)
Key Limitations: ARIMA produces linear projections that struggle with non-linear price dynamics and volatility clustering common in stock markets, and cannot account for external market factors like earnings announcements or macroeconomic events.
Chronos-Bolt for Time Series Forecasting
Chronos-Bolt, developed by Amazon, extends pretrained language models for time series prediction by using quantization and normalization. Unlike ARIMA, it tokenizes financial time series data to improve probabilistic forecasting accuracy. Key advantages include:
- Generalization across different market conditions with minimal retraining.
- Probabilistic sequence modeling that improves uncertainty estimation.
- Enhanced accuracy in predicting stock price movements over traditional models.
Sentiment Analysis for Financial Forecasting
A multi-stage sentiment analysis pipeline was developed to extract investor sentiment from social media posts:
- Data Collection: 30,000+ posts from WallStreetBets, Investing (Jan 1, 2022 – Dec 31, 2024) were collected. After applying keyword filters, 5,800 relevant posts related to S&P 500 IT sector equities were retained.
- Two-Stage Sentiment Classification:
- Stage 1: FinBERT pre-filtering classified posts into bullish, bearish, or neutral categories, reducing computational costs.
- Stage 2: GPT-4-o-mini refinement analyzed complex sentiment cases, maintaining high classification accuracy.
- Temporal Aggregation: Sentiment scores were aggregated daily and integrated into forecasting models.
Portfolio Optimization Using the Markowitz Model
Predicted stock prices were used for Mean-Variance Optimization:
\[\max_w w^T \mu - \lambda w^T \Sigma w\]where \(w\) represents portfolio weights, \(\mu\) expected returns, and \(\Sigma\) the covariance matrix. The optimization ensures:
- Fully invested, long-only positions with a 25% max allocation per stock.
- Risk aversion parameter \(\lambda = 0.25\). An investment simulation with $10,000 USD tracked portfolio performance over time, benchmarking against the S&P 500 IT Services Industry Index.

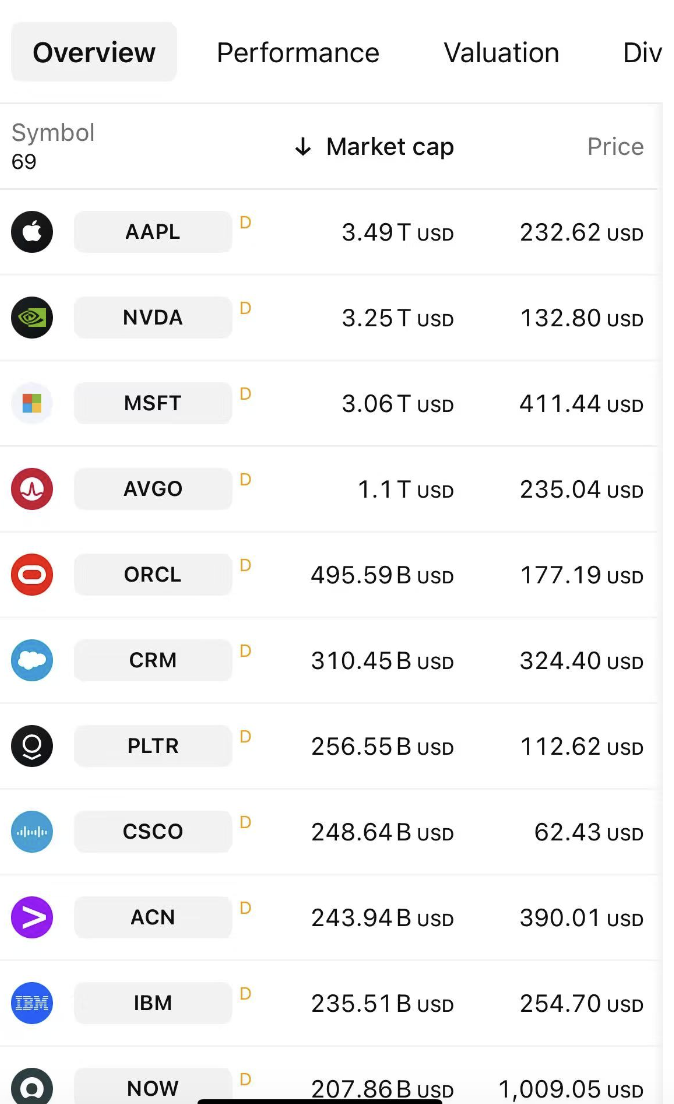
Top Market Cap Companies (source: tradingview.com)
Summary
This method integrates advanced time series forecasting, sentiment analysis, and portfolio optimization, demonstrating the potential of transformer-based models and investor sentiment signals in financial decision-making.