Results
Stock Return Prediction Performance
Our comparative analysis of ARIMA and Chronos-Bolt models for stock return forecasting revealed significant differences in predictive accuracy. The table below presents the Mean Absolute Scaled Error (MASE) for both models across various stocks in the S&P 500 Information Technology sector.
Comparing Predictive Accuracy: ARIMA vs. Chronos for Stock Forecasting
| Ticker | Company | ARIMA MASE | Chronos MASE | Chronos with Sentiment Analysis |
|---|---|---|---|---|
| AAPL | Apple | 4.404759 | 1.277648 | 1.187000 |
| MSFT | Microsoft | 2.577242 | 1.257515 | 1.194542 |
| NVDA | Nvidia | 1.667199 | 0.786434 | 0.650632 |
| AVGO | Broadcom | 2.358288 | 0.825056 | 0.760912 |
| ORCL | Oracle | 1.627883 | 1.002716 | 0.933530 |
| CRM | Salesforce | 3.041072 | 1.398177 | 1.258305 |
| CSCO | Cisco | 2.719316 | 0.767192 | 0.719300 |
| IBM | IBM | 3.873951 | 0.791281 | 0.740314 |
| ADBE | Adobe | 2.543290 | 1.136429 | 1.058090 |
| QCOM | Qualcomm | 2.539423 | 0.989846 | 0.907200 |
| AMD | AMD | 3.051562 | 1.095745 | 1.030000 |
| PLTR | Palantir | 4.264606 | 0.932880 | 0.886236 |
Key Findings from Predictive Accuracy Analysis:
- Chronos Outperforms ARIMA: Chronos consistently delivered superior predictions across all evaluated stocks
- Significant Error Reduction: MASE values were substantially lower for the Chronos model
- Sentiment Analysis Boost: When incorporating sentiment analysis, Chronos exhibited further improvements in prediction accuracy
- Additional Accuracy Gain: Sentiment-enhanced Chronos reduced MASE values by an additional 5-15% compared to the standard Chronos implementation
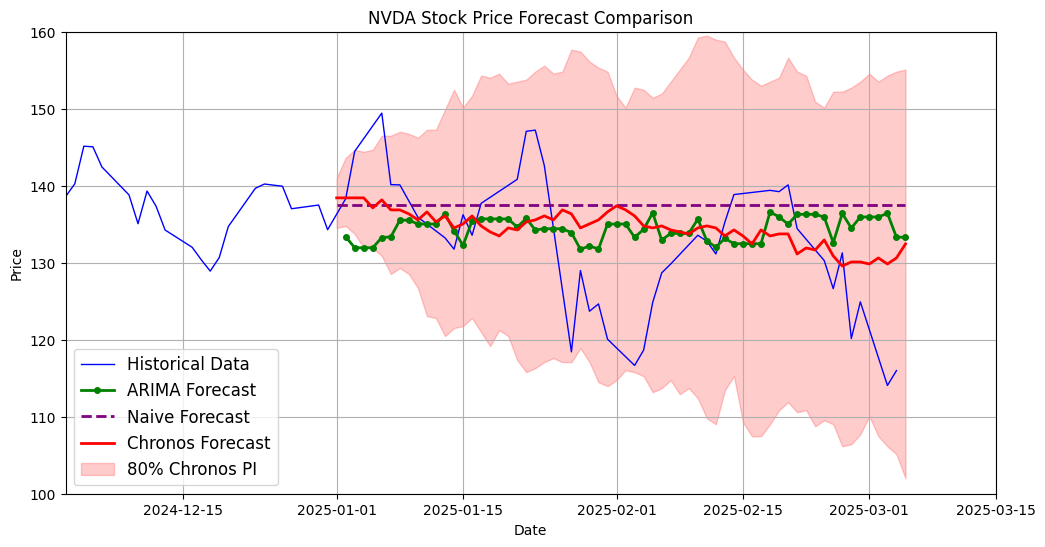
NVDA Stock Price Forecast Comparison

The plot above illustrates the prediction of NVDA stock prices using different models:
- Historical stock prices (blue line)
- ARIMA forecast (green dashed line)
- Chronos-Bolt forecast (red line)
- Naive forecast baseline (black dashed line)
- 80% prediction interval for Chronos-Bolt (pink-shaded area)
Visual Evidence: The figure clearly demonstrates Chronos-Bolt’s superior predictive accuracy, as its forecast aligns more closely with actual stock price movements compared to ARIMA.
Portfolio Optimization Results
Our portfolio consists of the stocks listed in the above table, with the following optimization parameters:
- Initial Allocation: Based on relative market capitalization
- Dynamic Adjustment: Weights updated using predictions and sentiment scores
- Diversification Constraint: Minimum weight of 0.05 per stock
- Risk Management: Risk aversion parameter of 2.5
- Starting Value: $10,000
For comparison, we evaluated performance against a benchmark portfolio maintaining fixed allocations based on market capitalization.

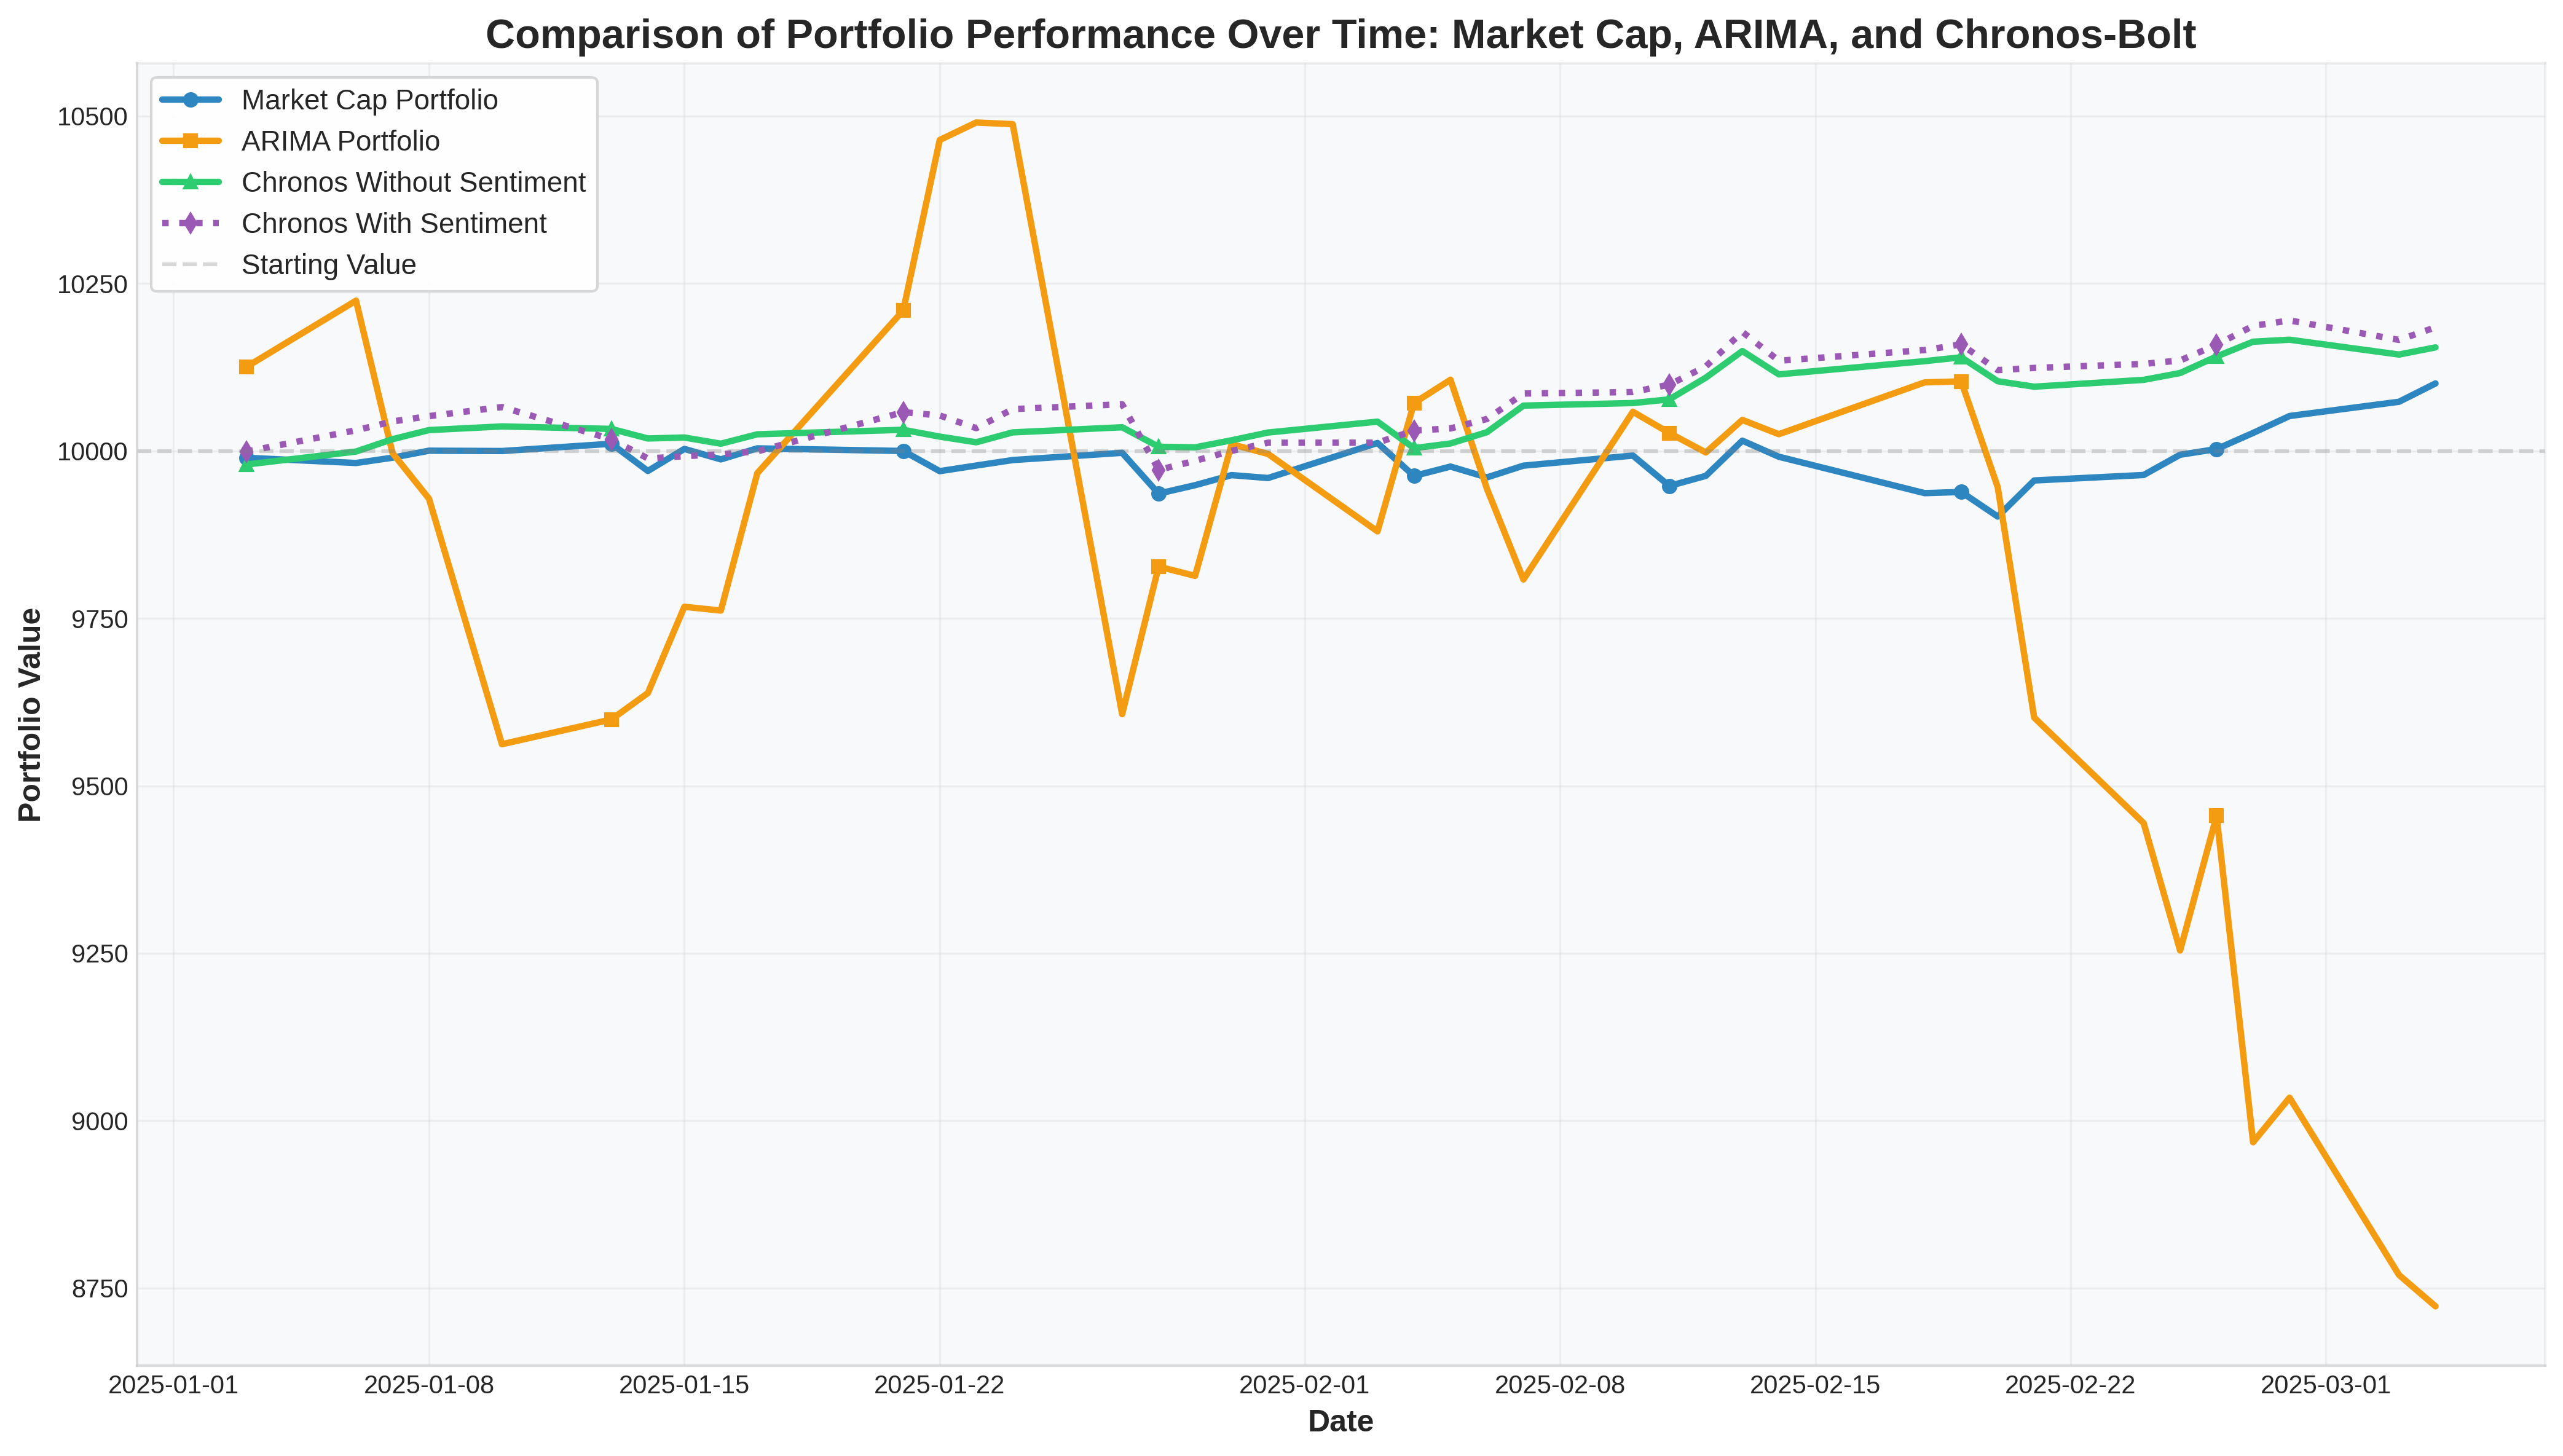
Portfolio Performance Comparison
Key Portfolio Performance Insights:
- Market Cap Portfolio (blue line):
- Maintained relatively stable performance
- Served as an effective benchmark for evaluation
- ARIMA-based Portfolio (orange line):
- Demonstrated extreme volatility
- Experienced sharp decline over the evaluation period
- Significantly underperformed compared to other approaches
- Chronos-Bolt Portfolios:
- Both versions consistently outperformed the Market Cap Portfolio benchmark
- Sentiment-enhanced Chronos-Bolt portfolio (purple dotted line) achieved the highest returns among all evaluated approaches
Conclusions:
✓ Results confirm our hypothesis that transformer-based models like Chronos-Bolt can capture complex patterns in stock market data more effectively than traditional ARIMA models
✓ The integration of sentiment analysis provides additional predictive power, resulting in superior portfolio performance
✓ For investors seeking enhanced returns, Chronos-Bolt with sentiment analysis represents the most promising approach based on our evaluation